
Digital Deliverance Newsletter #4: Clear Evidence Existed 20 Years Ago Websites Won’t Compensate for Print Edition Losses
When is a strategy recognized as disastrous? How long must its obvious devastation be experienced until it is called what it so clearly is? How much sheer volume of perennially negative data does it take to alert reasonably intelligent executives to the factual reality that they’ve executed a strategy which has become catastrophic?
Indeed, if a strategy has already failed for over a quarter century, how much longer until the executives who maintain it escape what otherwise appears to be a zombie-like condition in which they thoughtlessly stagger towards their doom?
In the cases of Mass Media executives, perhaps never. They executed a disastrous strategy for adapting to the changes wrought by the introduction of personal computer-mediated technologies into the media environment. They’ve hoped this strategy would at least reap revenues from online that are even greater than those which their printed products or broadcast services generated at the start of the 21st Century or at least compensated for any losses they incurred as consumers shifted media consumption habits to online rather than those traditional products and services. What they hoped clearly hasn’t occurred despite more than a quarter century elapsing. Yet rather than change, or even significantly alter this failed strategy, they mindlessly continue it despite its disastrous effect upon their industries. After all, why change course, even at the last minute, when you instead can go down with the ship?
I refer to what I term the ‘shovelware strategy’. The Mass Media industries simply shoveled onto websites the contents of their printed products and broadcast services. These industries hoped that consumers would use these websites the same ways (i.e., as frequently and deeply) as consumers had used their printed products and broadcast services during the 20th Century. Compounding that hope, the industries likewise shoveled onto these websites their theories, doctrines, business models, and traditional practices of Mass Media
Newspapers were the first sector of these industries to implement the shovelware strategy. They encountered personal computer-mediated technologies during the late 1970s and early 1980s in the form of news ticker scrolls in videotext; then as textual news stories in teletext experiments during the late 1970s through the 1980s; then in the form of third-party proprietary online services from then until 2000. When the Internet opened for public usage and the first multimedia Web browser software was developed, Mass Media companies were freed from having to split revenues with the videotext, teletex, or proprietary online services companies whose telecom systems they used. Newspapers instead launched their own websites and implemented the shovelware strategy. Other sectors of the Mass Media industries would follow their lead.
Within a decade, the newspaper sector was touting their shovelware strategy’s ‘success’ and believed they had data to prove it.
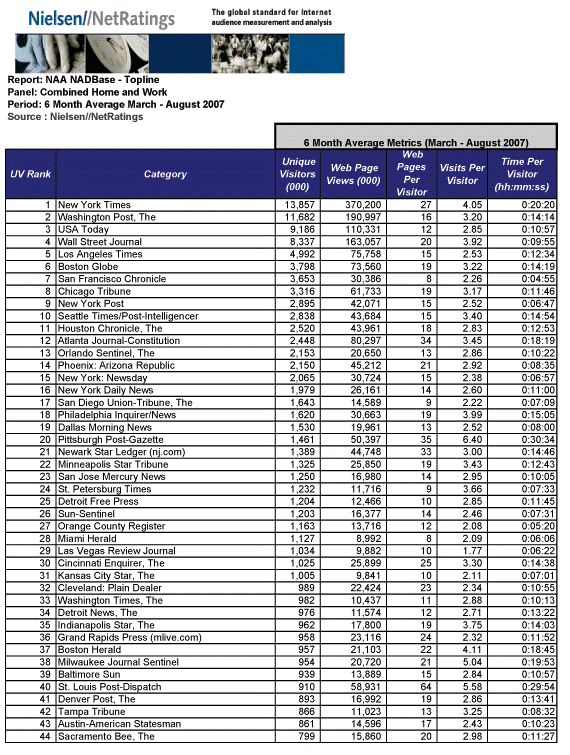
In 2007, the Nielsen//Netrating (‘Nielsen’) company released the data table about traffic at major United States daily newspapers’ websites during the middle of that year. Nielsen audited six months of the traffic data then divided that by six to approximate the average monthly traffic during that period. Look at the first three newspapers listed as examples:
- The New York Times led the list. Its website received an average of nearly 14 million ‘Unique Visitors’ to whom it displayed an average of more than 370 million ‘Web Page View.’ I’ll use the Audit Bureau of Circulations listings from 2007 to compare the ‘Unique Visitor’ totals: 1,120,420 copies on weekdays and 1,621,062 on Sundays,
- The Washington Post, whose printed circulation was 699,130 weekdays and 894,428 on Sundays, was ranked second on the list. Its website had an average of nearly 12 million ‘Unique Visitors’ who saw nearly 191 million ‘Web Page Views’.
- USA Today, whose 2,278,022 printed circulation was produced only on weekdays, ranked third with more than 9 million ‘Unique Visitors’ and more than 110 million ‘Web Page Views’.
The newspaper industry’s publicists, corporate suites, and executives who had launched the websites loved this data because it appeared to be proof that the shovelware strategy was working. However, they and other sectors of the Mass Media industries myopically couldn’t see the forest for the trees. It wasn’t the big numbers but each newspaper’s own array of numbers that told more important stories—a wider data panorama to see.
First, why does Nielsen conflate daily and monthly? It is good that Nielsen can identify individual users and not mistake them for another user if they return to a website more than once during that average month. Yet newspaper circulation, the number upon which their advertising sales rates are based, has always been calculated as a diurnal number: the total number of people who either subscribe to daily delivery of a copy or otherwise purchase a copy at newsstands, kiosks, or markets on that day. If a visitor to a newspaper’s website (particularly a website not charging for access, in the case of The New York Times in 2007) visits it only once per month, should such a free visitor count as equivalent to a paying consumer of a printed daily newspaper?
Second, Nielsen reports that the average user of The New York Times website visits 4.05 times per average month. That’s the equivalent of only once per week. Let that sink in. The website of the premiere daily newspaper in the U.S., and perhaps the world, is visited by its average monthly user only about once per week! Moreover, The New York Times didn’t start charging for access to its website until three years later. So, 4.05 times per average month is how infrequently the average user visits to this renowned newspaper’s website—even when accessing it is free.
Third, Nielsen reported that this average user saw 27 webpages during the average per month, which at an average of 4.05 visits per month means he probably sees an average of fewer than 7 webpages per visit. If that user happens to visit the website’s Home page during one or more of those 4.05 visits, he will see even fewer news story webpages per visit. The New York Times generally publishes only one story per webpage. Newspaper industry surveys prior to the opening of the Internet for public usage showed that an average user of a printed edition would read fewer than 7 stories per usage. However, that usage was considerably more frequent. The data back then indicated that the average user of a printed edition would use it 3 to 5 days per week. Yet using a printed edition only 3 to 5 times week is equal to 13 to 22 times per month. And even if that average consumer of the printed edition read fewer than 7 stories during each of his usages of the printed edition, then that means the approximate number of stories he read per month might have been 91 and 154. Compared that to the website’s average user reading no more than 27 news story webpages. No wonder many newspaper companies that have implemented the shovelware strategy are laboriously trying to improve ‘reader engagement’ with their publication’s websites!
Fourth, Nielsen reported that the average user spent an average aggregate total of 20 minutes and 20 seconds per month on The New York Times’s websites. That’s within only a few minutes of the total time a reader of the printed edition spends reading it on each of the average of between 3 to 5 days per week. In other words, the total amount of time the average user of this newspaper’s website spent there per month is merely 1/13th to 1/22nd the time the average reader of the printed edition spends reading it each month. Disengagement, indeed!
With very rare exceptions, the Nielsen data from other major U.S. newspapers are as bad or much worse. For instance, the average user of USAToday’s website visits it the equivalent of once every ten days and spends less than half the time than the average user of The New York Times’ website. The average user of The San Francisco Chronicle’s or the Miami Herald’s websites saw merely 8 webpage all month long and spent half again less times than the average user of USAToday’s website did. Even the average user of The Wall Street Journal’s website, the only one in this Nielsen table that in 2007 was charging consumers for access, had as infrequent and shallow use from its average user as the USAToday’s website did. Consider that consumers paying for access to a newspaper’s website made remarkably the same usage as consumers of newspapers websites with free access did.
These problems are even more grave because approximate three-quarters of this major U.S. newspapers’ websites charged advertisers only for the actual number of online ads that were exposed. Compare that to printed newspapers, in which advertisers are charged for the total number of editions sold (i.e., circulation), regardless of how many newspaper subscribers or purchasers picked up and read that edition. If your website’s average user visits on average of only 4.05 times per month, that’s how infrequently the website exposes ads to him. A website doesn’t deliver anything; its contents await retrieval.
The Nielsen data should have alarmed, rather than pleased, the U.S. newspaper industry and the other sectors of the Mass Media industries that implemented the shovelware strategy. More than a cursory look at the data demonstrated that consumers were NOT using these websites as frequently and deeply as consumers had used these newspapers’ print editions. The data likewise inferred that the traditional Mass Media business models didn’t work online.
When shortly after 2007 some media analysts and consultants began presenting the negative information in this and subsequent Nielsen reports, that company, under pressure from the U.S. newspaper industry, ceased publicly releasing such data.
During the 2010s, I began using this Nielsen data table as an analysis exercise for my postgraduate students. All were initially impressed by the large numbers of ‘Unique Users’ and ‘Web Page Views’. However, the more perceptive students soon noted all the potentially disastrous data interactions. So, why didn’t the U.S. newspaper industry’s executives. I think that they didn’t want factual reality to interfere with their mistaken belief that they’d made the correct decision to shovel their way towards the future rather than scientifically navigate there. ‘Management by seat of the pants’ my friend the late Murray Light, for his final 20 years the editor of the Buffalo News, called it in contrast to Management by Objective.
The U.S. newspaper industry continues its shovelware strategy in misadapting to computer-mediated technologies. Since 2007, the industry has lost some two-thirds of its readers and advertising clients and seen its annual revenues plunge from $44 billion to around $18 billion. During that period of titanic losses, the shovelware strategy generated $3 billion in annual revenues for this industry, hardly enough to compensate for the considerably larger losses. It is a number that hasn’t grown much this decade.
What the shovelware strategy has accomplished is to excavate the grave of the U.S. newspaper industry. Continuing will make the U.S. newspaper industry, with few outlying exceptions, posthumous. This distressed industry complains that it nowadays has few resources remaining to effect a change in course, which is ironic considering how few resources it initially gave the shovelware strategy in the late 1990s. During the next seven weeks of this newsletter, I’ll be writing about other mistakes the Mass Media industries made attempting to adapt to personal computer-mediated technologies. Then, I’ll begin to present solutions to the problems I’ve detailed.